
PerkZilla Lifetime Deal is a robust marketing platform that provides your brand with a competitive advantage through focused campaigns and automated tools.
LTDHUB is the ultimate resource for finding lifetime deals on software products. With LTDHUB, you can save time and money on your next digital product purchase.
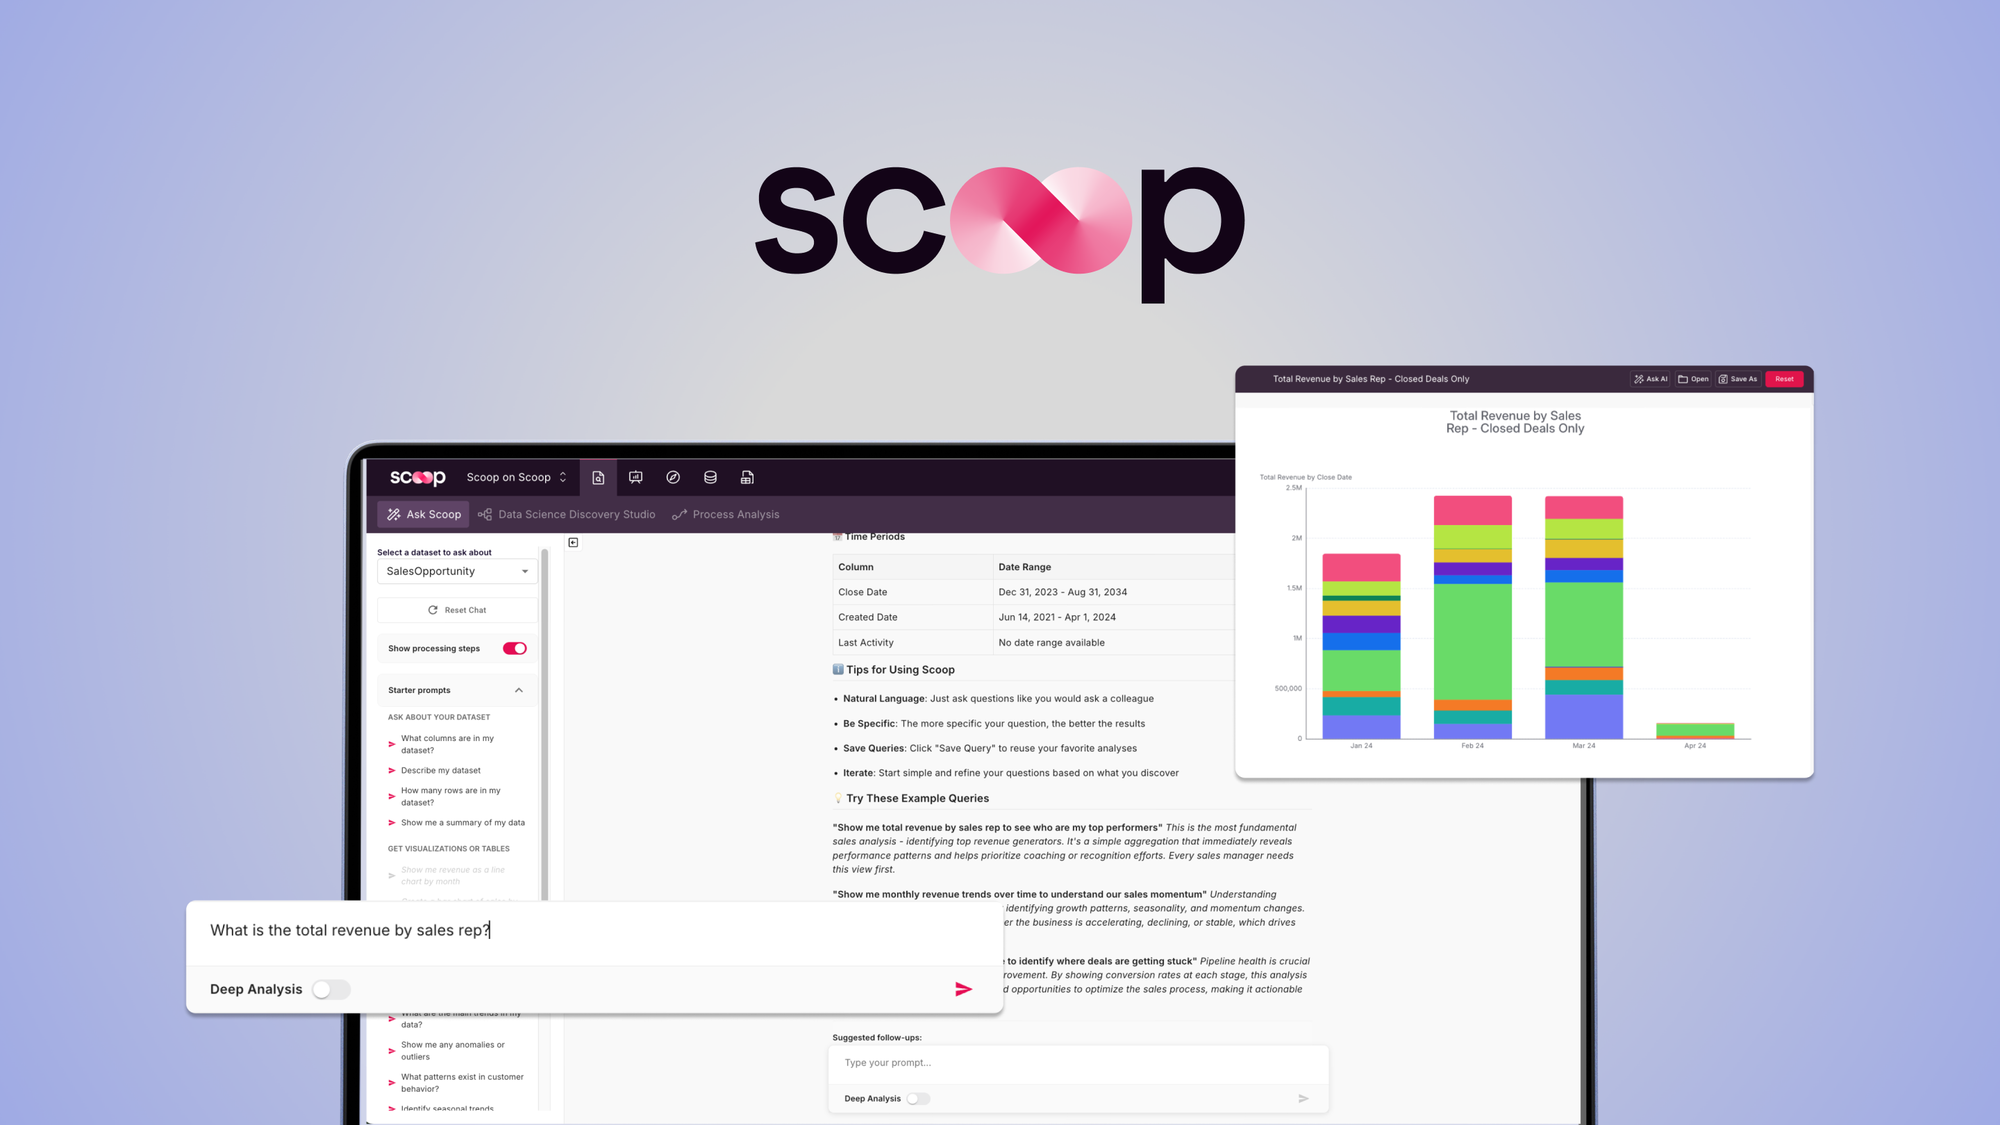

Scoop Analytics Lifetime Deal is an AI-powered platform that allows non-technical users to analyze business data, ask questions in plain English, and receive instant insights with real-time visualizations.
Scoop Analytics addresses a common problem in businesses: being “data rich but insight poor.” Many organizations struggle to extract actionable insights from their data due to complex tools or overburdened data teams. Scoop Analytics simplifies this process by allowing users to ask questions in plain English and receive AI-driven insights, complete with charts, KPIs, and data visualizations. The platform automates analytics workflows, eliminating the need for coding or technical expertise.
AI-Powered Insights in Plain English:
Real-Time Visualizations:
Follow-Up Questions & Intelligent Summaries:
Customizable Presentations:
Flexible Data Integration:
Scoop Analytics is described as intuitive and user-friendly, catering specifically to non-technical users. The ability to interact with AI in plain English eliminates the steep learning curve often associated with analytics platforms. Features like real-time visualizations and intelligent follow-up questions suggest a streamlined workflow. However, the platform’s limitations on data sources and more advanced functionalities may frustrate power users or larger teams.
Scoop Analytics offers three lifetime pricing tiers:
License Tier 1 ($79):
License Tier 2 ($149):
License Tier 3 ($289):
The pricing is competitive for SMBs but could feel restrictive due to limits on AI analytics requests and data sources.
Tableau:
Power BI (Microsoft):
Compared to these competitors, Scoop Analytics stands out as a simpler, more cost-effective option for SMBs and non-technical users.
Scoop Analytics was founded by Brad Peters, a seasoned professional who previously led enterprise BI products for Fortune 500 companies. His mission is to empower businesses by removing technical barriers to analytics. No explicit roadmap is mentioned on the landing page.
Verdict: Good for a Specific Audience
Scoop Analytics is a strong choice for small to medium-sized businesses and non-technical professionals who need quick and easy access to business insights without relying on IT or data teams. Its intuitive interface and AI-powered features make it ideal for sales managers, marketers, and operations teams looking to streamline their decision-making processes.
However, larger enterprises or users requiring extensive integrations and advanced analytics capabilities should explore alternatives like Tableau or Power BI. Additionally, the capped AI analytics requests in higher tiers may limit its appeal to power users.
If you fall within its target audience, Scoop Analytics offers excellent value at its competitive lifetime pricing.
PerkZilla Lifetime Deal is a robust marketing platform that provides your brand with a competitive advantage through focused campaigns and automated tools.
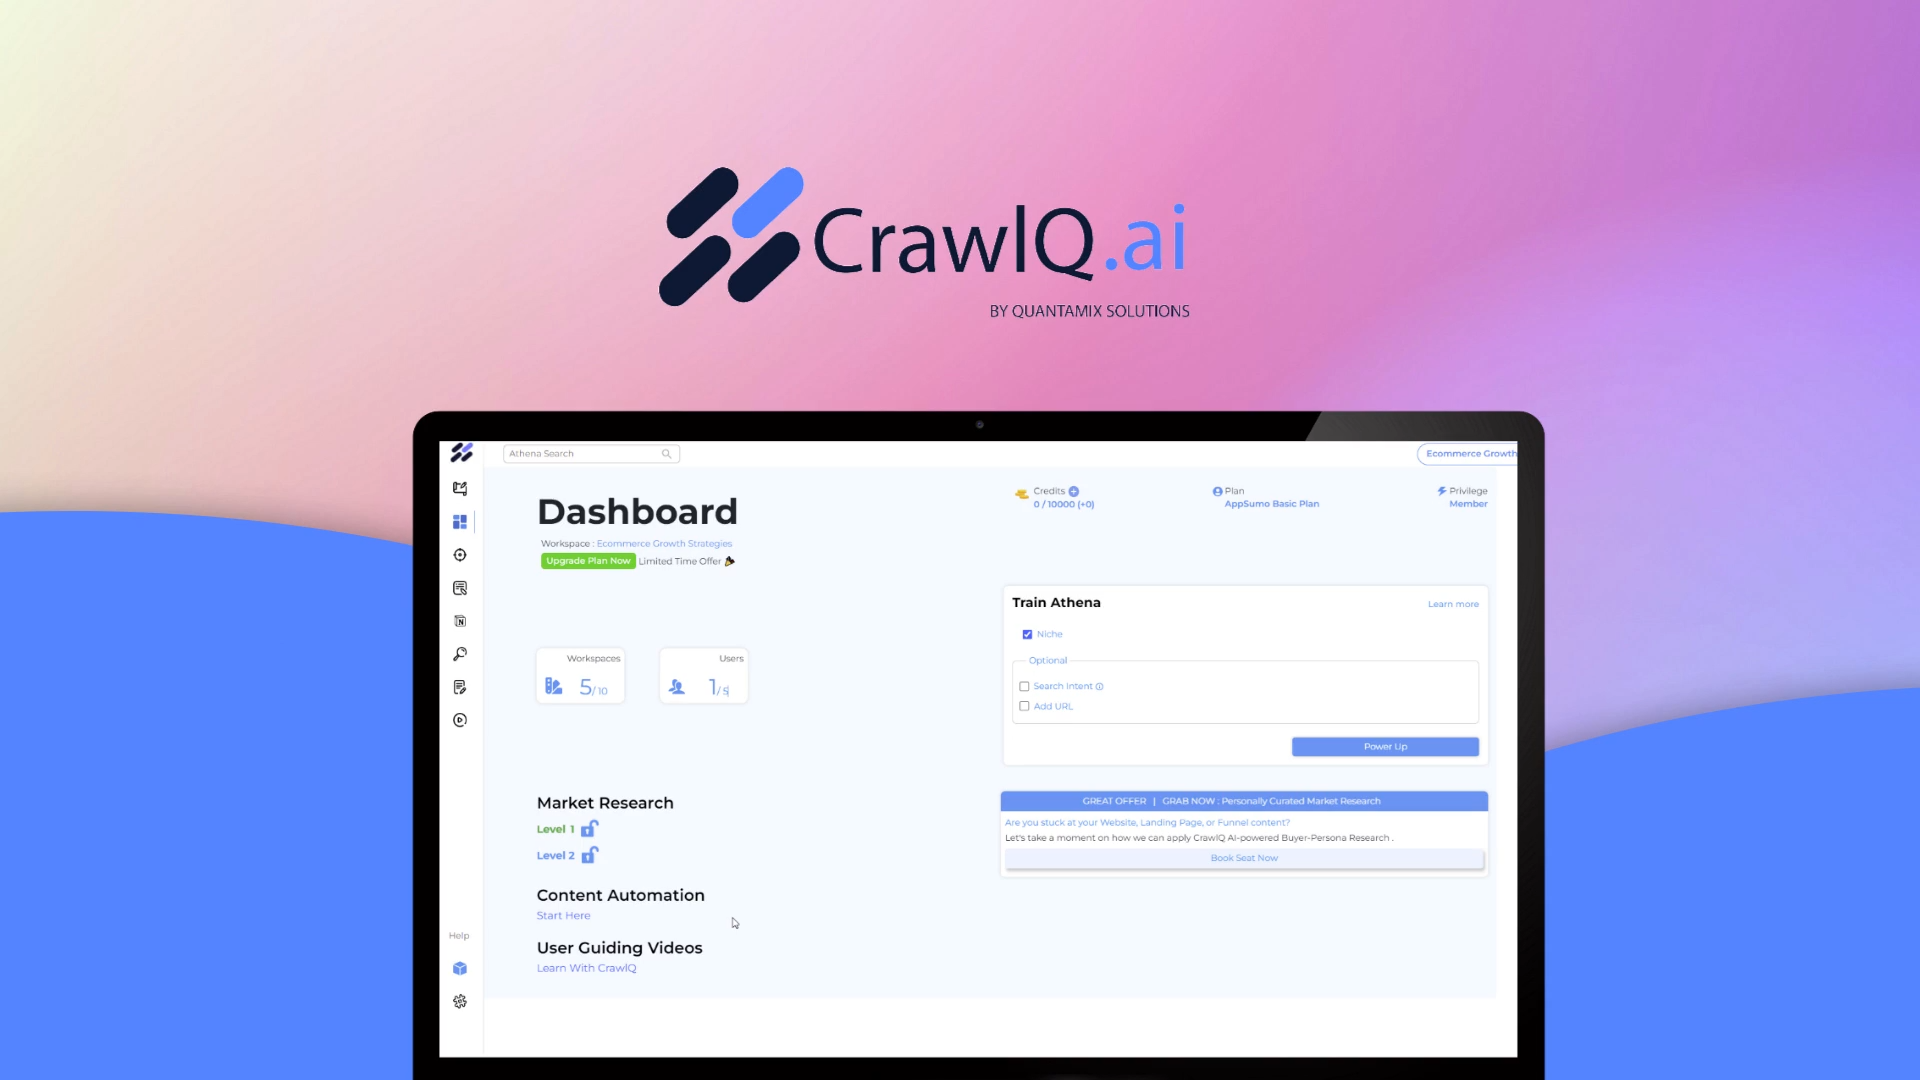
CrawlQ AI Lifetime Deal accelerates market research and provides data-driven insights to help businesses thrive efficiently and cost-effectively.
Linke Lifetime Deal is an all-in-one tool to manage, analyze, target, and track shared short links and bio pages with advanced features like alerts, retargeting, and customization.